
- News
- Women
- Magazine
- IndustryIndustry
- InsightsInsights
- Success Stories
- PublishPublish
- ContactContact
- Media KitMedia Kit

The move from manual trading to automated systems is not a prediction any more. It has already happened.
Look at the numbers. In India, algorithms accounted for about 57% of trades in the NSE equity cash segment in April 2026, up from 54% in FY25. In equity derivatives, algo participation reached roughly 70% of notional turnover in FY25. Ten years ago, that derivatives figure was closer to 50% (NSE Market Pulse, via Angel One).
This changes the question a firm needs to ask. When only a few institutions could automate, automation was itself an advantage. Now that most volume is automated, automation is just the cost of taking part. Starting is easier than ever. Building strategies that keep working in live markets is not.
So understanding what algorithmic trading is is only the first step. The harder question is what it takes to do it well.
At its simplest, algorithmic trading means using computer programs to place trades based on predefined rules, market data, and quantitative models. Instead of deciding in the moment, you apply logic that has been written down, tested, and applied consistently. This was once the preserve of large institutions. It is now within reach of trading teams of almost any size.
A decade ago, institutional trading sat behind barriers that smaller firms could not cross: proprietary infrastructure, dedicated data engineering teams, and capital requirements running into millions.
What changed is not the level of skill needed to compete. It is the cost of the tools needed to get there. Mid-sized asset managers, family offices, and independent trading firms can now build research and execution workflows that would once have needed an institutional-scale operation. Cheap computing power, low-cost cloud storage, and reliable connectivity did most of that work.
Python has become the standard language for research and medium-frequency trading, mainly because it is readable and because its open-source libraries cover most of what a quant needs: data handling, statistical modelling, and backtesting, at no licence cost. Firms that need ultra-low latency, such as high-frequency trading desks, still use C++ for execution. For everyone else, the same language used for research can go straight into production.
The market for these tools continues to grow, though estimates vary widely by research firm. Grand View Research expects the global algorithmic trading market to reach USD 42.99 billion by 2030, growing at 12.9% a year from 2025 (Grand View Research). Other firms publish materially different numbers, so the direction of travel is more reliable than any single figure.
Building an automated trading system is not mainly about writing code to place orders. Most workflows involve several stages: collecting reliable market data, researching ideas, backtesting, managing risk, and monitoring live performance. As strategies grow more complex, teams add cloud infrastructure, APIs, and automated execution to improve reliability and scale.
Getting the technology right is only half the job. Finding a durable edge needs a careful approach to data.
Quants usually combine several data types: market data such as price and volume, fundamental data such as earnings and GDP, and technical indicators such as RSI or Bollinger Bands. Some researchers also use alternative data, including news sentiment or satellite imagery. These can add something, but they need careful validation before they go anywhere near a live model.
Feature engineering is the process of turning raw data into signals a model can use. That might mean rolling averages, correlations, or measures of how far a price has moved from its usual level. Scaling matters here. Inputs like price and volume operate on very different ranges, so they need to be brought onto a common scale, otherwise the model reacts to the size of the numbers rather than the pattern in them.
Backtesting is where inexperienced teams lose the most money, though they only find out later.
It is not hard to find parameters that would have worked beautifully in the past. That is the problem. Test enough combinations and something will look excellent by chance. This is overfitting: the model has learned the noise in the historical data rather than any lasting relationship. Cheap tools make this risk worse, not better, because they let you test far more ideas against the same data.
Doing it properly means testing against realistic conditions: brokerage costs, taxes, and slippage, which is the gap between the price you expected and the price you got. In thin markets, slippage alone can wipe out a strategy's theoretical profit.
Teams typically look at the Sharpe ratio to judge risk-adjusted returns, though what counts as a good Sharpe ratio depends on the strategy, market, trading frequency, and objectives. Maximum drawdown, the largest fall in portfolio value, and the hit ratio, the share of winning trades, are also worth tracking. No single number tells you enough on its own.
AI and machine learning are now widely used in quantitative research. ML models can pick up complex relationships in large datasets and, when retrained and validated carefully, adjust to changing conditions.
Adoption is climbing quickly. A J.P. Morgan survey found AI use among hedge funds rose from 18% in 2024 to 46% in 2025 (Hedge Fund Alpha).
In practice, supervised learning is often used for price or volatility prediction. Reinforcement learning goes further, using an agent that learns by trial and error in a simulated environment, which suits problems like order execution and portfolio allocation.
Large language models have also entered the workflow, mostly for drafting code, summarising research, and speeding up early analysis. They are useful, with one caveat worth stating plainly: they can produce confident, incorrect output. Anything they generate needs checking before it reaches research conclusions or production systems.
For institutions, risk management is not a layer added once the system works. It is built in at every stage, from limits on a single strategy to firm-wide exposure controls.
Automated checks run continuously, watching for volatility spikes, breached position limits, and execution errors before they grow. Kill-switch logic can pause or stop trading automatically when thresholds are crossed, which gives risk teams a structural safeguard rather than a reactive one. These systems also catch "fat finger" errors, where a wrong input could otherwise trigger a very costly trade.
Volatility tends to cluster. Periods of market stress often continue across several sessions instead of resolving in a day. Systems can be designed to recognise these conditions and reduce position sizes or pause activity when risk limits are hit.
Regulation is moving in the same direction. SEBI's February 2025 framework for retail participation in algorithmic trading is a good example of what supervisors now expect. Brokers act as principal and algo providers as agent. Open, unrestricted APIs are not permitted. Access requires client-specific keys, whitelisted static IPs, and OAuth-based logins. Every algo order routed through a broker API must carry a unique exchange-issued identifier. Retail traders who build their own algos must register them with the exchange beyond a specified orders-per-second threshold. The compliance deadline moved from August to 1 October 2025 after industry feedback (Finsec Law Advisors).
The theme across jurisdictions is similar: traceability, audit trails, and control. For a firm, this means order tagging, access management, and reconstruction capability are design requirements from day one. Adding them to a live system later is far more expensive.
Two recent episodes are worth sitting with.
In mid-2025, several large systematic funds went through a sustained losing stretch. MSCI's analysis pointed to crowding and a sharp momentum reversal rather than broken models (MSCI). PivotalPath data suggested the average quant fund returned about 7.7% for 2025, trailing both the average hedge fund and the S&P 500 (CNBC).
These are firms with excellent data, infrastructure, and research talent. Their difficulty came from other sophisticated players holding similar positions at the same time. A backtest cannot tell you how crowded a trade will become. That is a capacity and risk question, and it becomes more pressing as good tools spread.
Separately, in July 2025, SEBI passed an interim order against Jane Street alleging manipulation of the Bank Nifty index, impounding ₹4,843 crore. The firm deposited the amount in escrow, resumed trading in India later that month, and has appealed. The case is still before the Securities Appellate Tribunal and the allegations have not been finally decided (CNBC).
The point is not the verdict. It is that automated systems act at a speed and scale that make questions of market impact and intent much harder to answer afterwards. Surveillance and trade reconstruction are part of the trading system now, not an administrative afterthought.
Wider access to algorithmic trading has not made it easier to make money. It has raised the bar for what counts as a starting point. Simple rules-based approaches, such as moving average crossovers, still have value as teaching tools and as building blocks, but they need testing across different market regimes before anyone trusts them with capital.
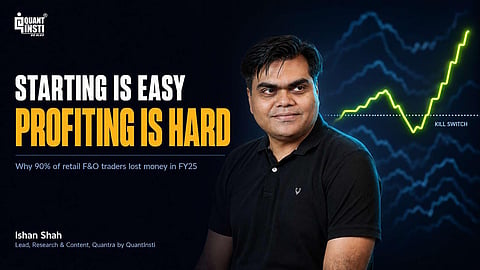
It is also worth noting what has happened as tools have become more accessible. SEBI's study found individual traders in India's equity derivatives segment lost about ₹1.06 lakh crore on a net basis in FY25, 41% more than the previous year, with over 90% of participants ending the year in the red (Business Standard). Better access to tools has not, by itself, produced better outcomes.
Manual trading still suits many investors and discretionary managers. But where strategies need to be tested, monitored, and executed consistently, systematic approaches have become the norm. For teams looking to scale research and execution, a systematic process offers a more structured and repeatable way to work.
For firms building or expanding systematic capability, the strategic question is no longer whether to automate. It is whether the research discipline and risk governance exist to do it responsibly. That means being able to answer some fairly basic questions clearly: Who approves a strategy going live? What evidence is required? What triggers a shutdown? Who reviews live performance, and how often?
The tools are accessible to almost everyone now. The judgment to use them well is what still separates firms. As automation continues to spread, the most valuable skills remain unchanged: asking research questions worth answering, examining evidence critically, and managing risk with discipline.
Ishan Shah
Lead, Research and Content, Quantra
Ishan Shah is the Lead, Research and Content at Quantra by QuantInsti, specialising in statistical arbitrage, systematic trading, and quantitative strategy development. He has prior experience with Barclays and Bank of America Merrill Lynch, and has co-authored Machine Learning for Trading. He has spoken at various workshops organized by PyData Mumbai, SGX, IBKR Campus, Zerodha Varsity, Face2Face Conclave. Ishan is known for simplifying complex trading concepts and helping learners build, test, and improve algorithmic trading strategies using statistics, data, and disciplined research.
Follow us on Google News